
Excel Should Be Easy
Excel should be easy . . . to use. Maybe not to program, but Excel should be dead easy to use. And it is, if it’s programmed well.
Let’s look at a basic, but practical, example: a scheduling tool. We need to know 1) who is working when, 2) how many hours each person works each week, and 3) who is working each day.
Setting up the Metadata
The first step in creating any spreadsheet is determining what data is needed. For our scheduling tool, we need a record of when each employee works. Once we know what data we need, we can determine what metadata underlies that data. Metadata is all the data that underlies our real data. Think dropdowns.
For this workbook, we need to know who our employees are, what their roles are, and how many hours they can work each week.
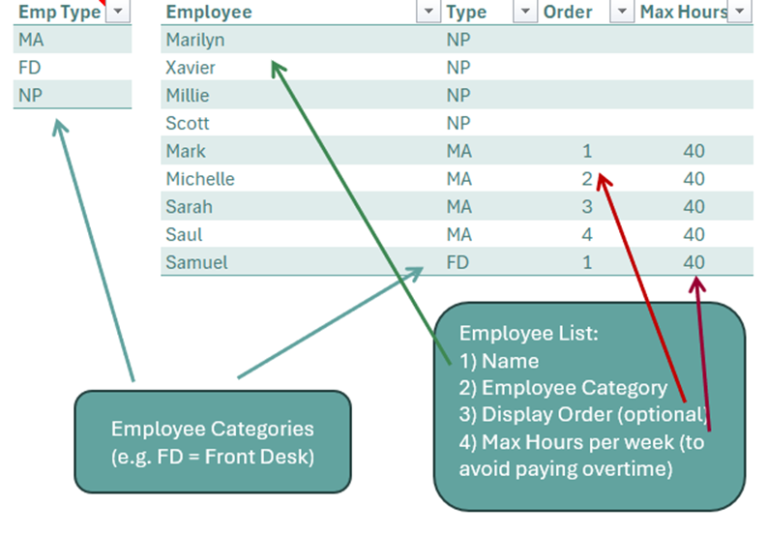
For this project, we create two metadata tables. One categorizes employees by type. This could be waitress, busboy, BOH; cashier, stocker, manager; or whatever applies to your business. The second lists employees by name and includes their employee type, maximum allowable weekly hours, and an optionable report order (more on that later).
Setting up the Main Data Table
With the metadata established, we’re ready to build our main data table. For this project, it’s a simple table to record each employee’s shifts. To ensure accurate data, validation is applied to ensure dates are dates, times are times, and the employee is selected from the employee list.
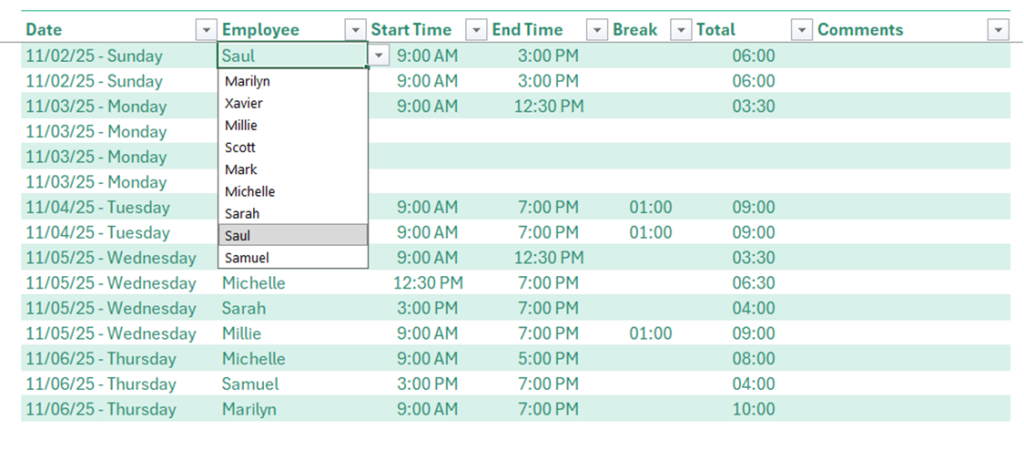
We added some extra columns to our table to record unpaid breaks, calculate total hours worked on the shift, and any comments for future reference.
That’s it! Nothing else is needed! The user will simply add new days and shifts at the bottom of the table, and our master schedule will automatically grow. We have everything we need to build our summary reports.
DAFs = Automatic, Flexible Reporting
Dynamic Array Functions (DAFs) are formulas entered in a single cell that “spill” their result into multiple cells. DAFs are the key to flexible reporting in the new Excel. Because they are dynamic, they shrink and grow as your data changes. That means you set them up once, and you’re good forever.
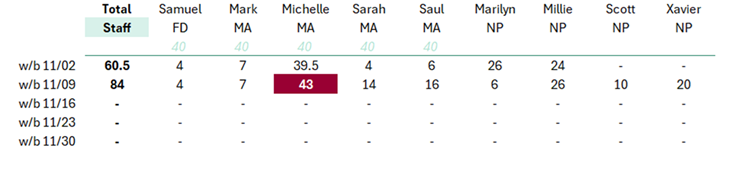
The report above shows the number of hours scheduled per employee over a five-week period, with weekly totals at the left. This report is built with just four formulas. Let’s look at each of them.

The first formula generates the headers. HSTACK pulls the Employee, Type, and Max Hours columns from the lstEmployees table (from our metadata page). SORT(. . ., {2,1}) sorts the data by employee type and then by name, alphabetically. Finally, TRANSPOSE turns the selection on its side, so the employees become column headers.
IFBLANK is a custom Lambda function that returns “” if a source cell is blank. In this formula, it prevents blank Max Hours values from being returned as 0
Because this formula pulls directly from the lstEmployees table, if a new employee is added, they will automatically show up in the list. That is why this formula is “dynamic.”

The second formula generates the list of dates on the left-hand side of the table. SEQUENCE creates a number of entries. CalendarStart is the first day of this reporting month. It may be from this month or from last month, depending on how you count the weeks of a month. The first parameter, 1+ROUNDDOWN((EOMONTH(CalendarStart,IF(DAY(CalendarStart)>20,1,0))-CalendarStart)/7,0), tallies how many weeks should be displayed for this month, based upon the CalendarStart day. (This will be four or five weeks.) The second parameter of SEQUENCE is the number of columns. It is blank, because we only want one column of results. The third parameter is the first value, the CalendarStart date. The final parameter, 7, is the number of days to jump between entries (seven days in a week).
The result is a series of week-beginning dates, which are formatted with a custom number format to show “w/b mm/dd”.
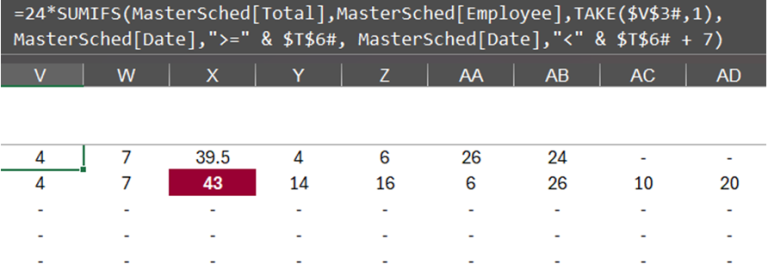
The third formula is the muscle of our report. It sums the number of hours each employee works in a week. Let’s look at this formula in detail:
- $V$3# is the address of the header formula. So, TAKE($V$3#,1) provides an array of employee names.
- $T$6# is the address of the date formula.
- SUMIFS sums the values in a specified range where certain conditions are met. Translating our SUMIFS formula into English, it says,
- Sum the values in the Total (hours) column of the MasterSched Table (the “main data table”) where,
- The Employee column matches this name in the header (TAKE($V$3#,1) and
- The Date column is greater than or equal to this date ($T$6#) and
- The Date column is less than 7 days after this date ($T$6#).
- The result of the SUMIFS is then multiplied by 24 to convert hours in a time format into a decimal number of hours.
Because this formula references two dynamic ranges, $V$3# and $T$6#, this formula is also dynamic, shrinking and growing as the number of weeks or employees changes.
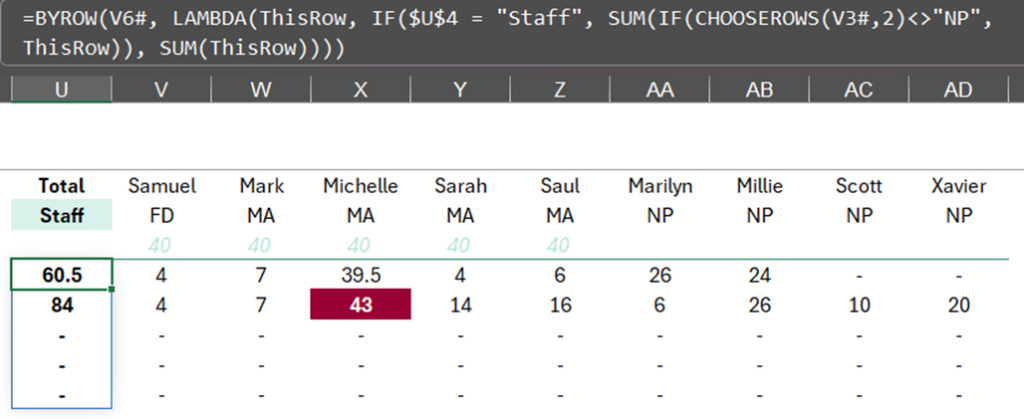
The final formula totals the weekly hours worked by all employees. In its simplest form, this formula could be written as =BYROW(V6#, SUM), meaning sum the records across each row. In this case, the formula was complicated slightly with an IF statement to sum either all hours, or all hours except “NPs”, based upon the dropdown in cell $U$4 (showing “Staff” in this example).
Four formulas. That’s all it took, and we have a dynamic report that will automatically adapt to additional workers or weeks, without requiring any manual changes. Conditional formatting was applied to additional rows to the right and below, so if the report grows, the new cells will still be properly formatted. Additional conditional formatting was applied to highlight (in red) any employee who exceeds their maximum working hours in a week (to guard against overtime wages).
This shows how a few simple DAFs can remove the need to manually adjust reports when circumstances change. As a bonus, let’s see what happens when we fully leverage the power of DAFs.
LAMBDA = Fully Customized Reporting
Lambda is a DAF that allows you to create your own custom functions in Excel. For instance, the IFBLANK function referenced above is a Lambda function. While Lambdas can be as simple as a single line of formula code, they can also be a complex, fully-coded solution.
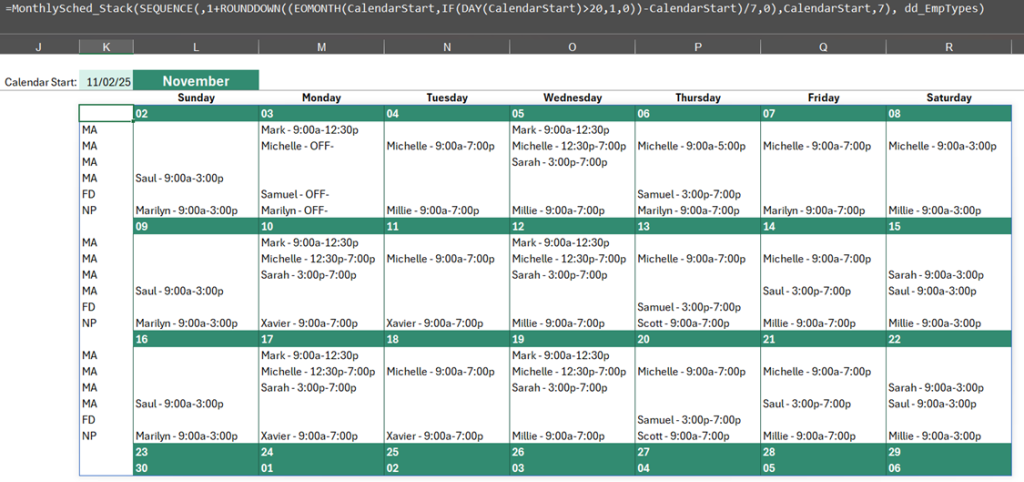
The calendar displayed above was built with a trio of Lambda functions. We’re not going to delve into these functions in detail. Instead, consider how this calendar is fully flexible:
- Any month can be displayed by changing the value in K2.
- It will automatically shrink or expand to accommodate the number of employees scheduled.
- More or fewer weeks can be added by simply changing the number of rows returned by SEQUENCE.
- If a new employee type is created, it will automatically be added to the calendar.
Even more incredible, this full report is generated with a single formula. This is the power of leveraging DAFs. This is the power of the new Excel.
For those curious, here are the three Lambda functions:
- WeeklySched assembles a weekly scheduling block for a single employee type (e.g. MA). If the “Order” column is used in the lstEmployees table, that employee will always appear in that row, when scheduled. For instance, Mark will always appear in row 1 and Michelle in row 2 of a week.
- WeeklySched_Stack invokes the WeeklySched Lambda for each employee type and stacks the output, creating a full schedule for a single week.
- MonthlySched_Stack invokes WeeklySched_Stack for each week in the month, creating the full calendar.
Complicated is Easy
We opened by saying, “Excel should be easy.” When you look at this file, it’s true. Any Excel user can add new records to the master schedule, adjust the calendar starting date, and print off a schedule. Nothing could be simpler. Creating the reports . . . that’s not quite as simple. The monthly calendar might require bringing in a pro. But with some practice and time, any intermediate user could build our weekly summary table. And that’s the key.
Dynamic Array Functions put immense power into the hands of even intermediate users. DAFs get us thinking beyond individual cells. DAFs get us thinking about concepts, blocks, and solutions. DAFs move us from overly complicated spreadsheets into simple solutions (with complex formulas).
If you want a copy of this spreadsheet to review or use, download a copy here.