
Encoding and Decoding Data with LET
I completed a large project for a real estate company. Together, we created a valuation model for a 1,000+ location commercial property portfolio. Naturally, the workbook contained the requisite Data and metadata Lists worksheets. But the two primary sheets were the:
- Portfolio Summary sheet, which contained characteristic and summary data for every property.
- Property Detail sheet, which displayed that characteristic data, calculated income and expense projections, and generated a terminal valuation for a single property.
Here was the rub: the Property Detail sheet was the primary calculation engine for projection and valuation calculations, but it could only calculate that data for one property at a time. And we needed to include some of those calculations on the Portfolio Summary sheet for every property.
We could have cloned the Detail sheet one thousand times, but that would have made the workbook unwieldy. It would have made changing the Detail page impossible. And, most importantly, it would have violated every spreadsheet design principle we hold dear at The New Excel.
The Income-Expense Grid
So, how do we transfer those calculations from a single Property Detail sheet onto the Portfolio Summary sheet for every property? Fortunately, most of those calculations were found in a single grid on the Property Detail sheet. Even more fortunately, that entire grid was calculated by a single Lambda function: IncExpGrid.
I always favor building reports with a single Lambda formula. Doing so not only allows the same calculated values to be used over and over again (without recalculating them each time), but our Lambda approach allows us to program based upon concepts and not a single set of values.
For our property valuation model, that meant we could handle properties with three years of historical data with the same code as properties with a single, estimated year of “historical” data next year.
To build the income and expense grid, the Lambda walked through the same steps an old-fashioned Excel programmer would:
- Gather the actual historical revenue and expense category data.
- Apply my client’s “special sauce” to project next year’s income and expenses.
- Extend those projections forward until the terminal year.
Where Lambda programming differs from old-school Excel is that all three of those steps occurred within a single function that, as a final step, arranged and displayed the results on the Excel grid.
Lambda isn’t an unwieldy behemoth. It’s a new approach to Excel that invites modular design. The “special sauce” used in the projections was baked into a half dozen other sub-lambdas called by the master reporting Lambda.
Enter LET, with an assist by VBA
Okay, so now we have all the income and expense data for a single property. How do we translate that for EVERY property all at once?
I’m not going to lie. IncExpGrid is a big Lambda with a lot of calculations. While it works quickly for a single property, we do not want it recalculating for 1000+ properties every time there is a change.
Enter LET . . .
I created a LET formula that retrieved the values required by the IncExpGrid Lambda. Invoking IncExpGrid within the LET formula put all those juicy data points in memory and within my grasp.
The rest of the LET formula extracted the pieces I needed to calculate additional values for each property: over two dozen calculations! But because I only had to invoke IncExpGrid once per property, I could do all those calculations quickly.
. . . with an assist by VBA
As quickly as it could do those two dozen calcs, I didn’t want them recalculating endlessly, so I wrote a VBA macro that would – at the touch of a button – copy the LET formula down 1000 rows, calculate those two dozen (plus) values for every property, replace the formulas with values, and append the values as columns in my main property data table.
Start to finish, 32,000 complex calculations were performed and saved as values in 16 seconds!!
Encoding and Decoding Data with LET
The granddaddy of these calculations came from a huge request. We wanted to create portfolio-wide graphics to plot the total number of properties, the total number of rental units, and the total amount of rent generated for each forecast year.
Easy, right? We have the IncExpGrid with all that data.
Yes, but . . . To do that, we had to have the full Income-Expense grid . . . for every property . . . available at the same time. Not just the summary data, but the year-by-year rent, so we could line up years for properties with different starting and ending times.
So, how do we do that?
First, we encode the data. We’re already invoking the IncExpGrid in our LET above. Pulling data from the IncExpGrid, I arranged the property name, data year, rent, and unit data into an array and encapsulated it in a single value using the ARRAYTOTEXT function.
This data was returned to a single cell for each property in a format like . . .
{“PropertyName”,2025,10000,10;”PropertyName”,2026,10030,10;….}
Having used LET to encode all our rent and unit information, we’ll, obviously, use LET to decode it.
Using the DROP(REDUCE(LAMBDA(VSTACK trick, I split the data into a giant array showing Property Name | Data Year | Rent | Number of Units for every . . . single . . . year . . . and property.
Now, the data is mine to do whatever I want with it. Average, Sum, Count, or anything I can imagine. Here’s what I did:
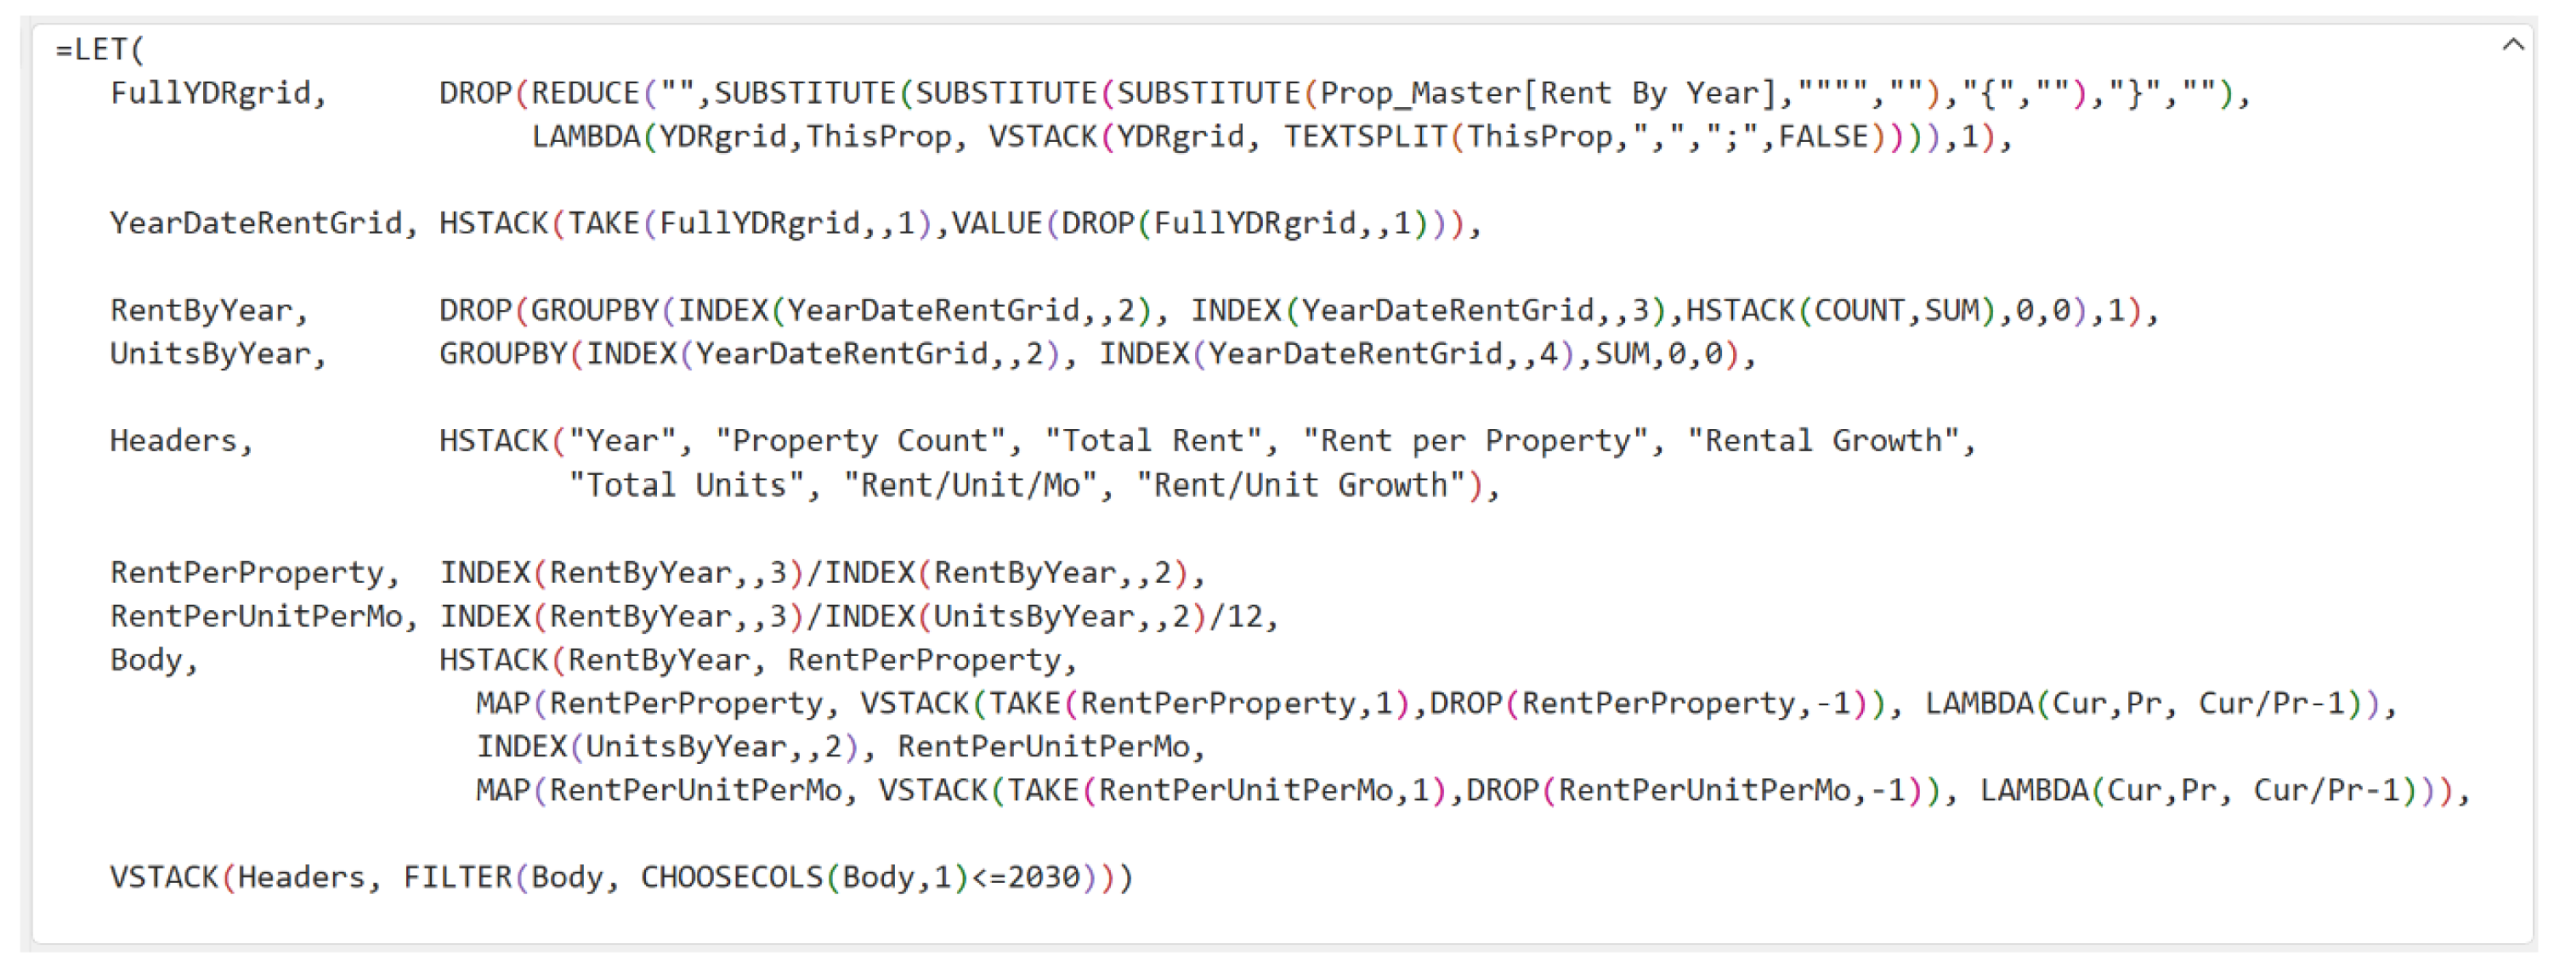
With this, I extracted – by year – the count of the
properties, total rent, average rent per unit, and more.
The LET/LAMBDA combo we deploy at The New Excel isn’t about
complexity; it’s about control. It’s about controlling your data, so it does exactly
what you need it to do, no matter how big the ask.
Comment
Comments are closed.
Christopher
David, your use of LAMBDA in custom Excel solutions sets you apart.
LAMBDA separates the ……..
I always enjoy seeing your custom solutions; I always learn something. You are a top-notch developer, and your use of LAMBDA, well, that is significant in the New Excel.
Tables, Power Query, DAFs, and VBA. That is the sweet spot. LAMBDA takes it to another level.