
Case Study • Payroll Processing • Payroll & Billing Reconciliation
Manual tabulation. Mismatched totals. Gone. Numbers that check themselves.
A centralized payroll and billing engine for a medical case-review network, with dual-engine audit reporting and executive dashboards, delivered and in active use since November 2024.
The Challenge: Two rate structures. Dozens of providers. Multiple insurers. Years of accumulating history. How do you reconcile all of that by hand, every month, and still trust the numbers at the end?
The client’s physician reviewers logged completed case reviews and billable activities each month — work billed to insurers at one rate and compensated to providers at a separate rate. The correct rate depended on review type, practice, and whether the work was done on a regular working day. The log had no data validation to keep entries clean, and both billing and payroll had to be assembled by hand.
The bottom line: With manual aggregation and messy data, mistakes meant missed revenue, upset providers, and numbers nobody trusted.
Structured
One set of rate tables governs every dollar the system calculates. One validated provider log keeps incoming data cleaner.
Automated
Power Query rolls up activity across months and providers, auto-classifying every entry for accurate billing and pay.
Tailored
Summary and detail reports run on two independent engines — cross-checking each other automatically, every month.
How I Built It
What data is needed?
Primary Data
Case Reviews & Hourly Activity
Per-provider case-review and hourly-activity entries, including date, insurer, review/activity type, result, and auditing notes.
Metadata
Rosters, Rates, & Rules
A provider roster with default practice type and special rates; billing and payroll rate tables broken out by insurer, review type, and day type; and a holiday calendar.
Where does it come from?
Primary Data
Validated Entry
Each provider logs cases and activities inside structured Tables, with data validation catching entry errors before they leave the log.
Primary Data x Metadata
One Monthly Import, Fully Priced
A monthly Power Query import rolls every entry into one database, pricing each record against the rate tables before it hits the worksheet.
Structure
Rules-Aware
Records are flagged for hourly-paid providers and weekend/holiday work, so billing and payroll is calculated precisely and auditing can be performed quickly.
What do you need to do with it?
Reports
Detail, Summary, and Top-Line Reports
Reports break out results at all levels:
- Details broken out by provider, case/activity, practice type, and day type for each billing unit.
- A summary report showing case and activity totals for all providers in one place.
- Final totals per billing unit and payroll totals per provider, with month-over-month comparisons.
Dashboards
Provider and Case Activity, and a 12-Month View
Parameterized dashboards provide insights on company health and show who and what is driving revenue:
- A Case Dashboard shows case volume and billing totals over time, highlighting areas of strength or weakness.
- A Provider Dashboard groups results by provider across months or by month for all providers, illuminating important trends.
- Rolling totals by billing unit for the past year provide a quick read the company's direction.
Custom Output
Two Engines, Checking Each Other
Two independent engines calculate the same totals two different ways:
- Mismatches flag data anomalies automatically and facilitate reconciliation.
- Matches provide immediate confidence in both the billing and payroll totals.

Fig. 1 — Final totals show the key, top-line numbers in a single glance.
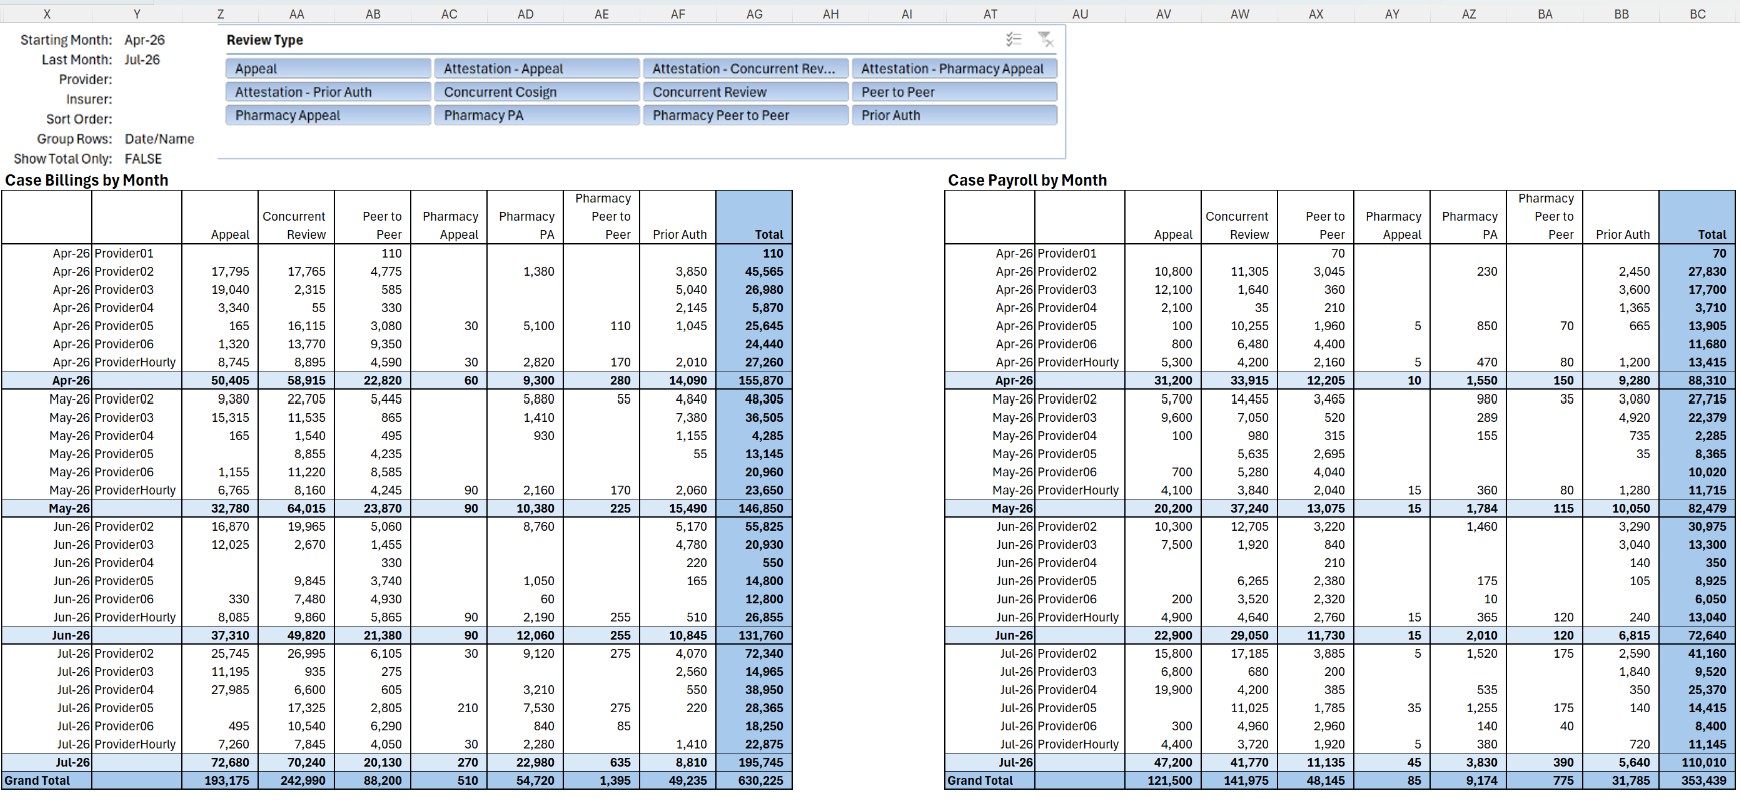
Fig. 2 — Provider dashboard shows who is driving revenue.
What Was Built
This system runs the client’s actual monthly payroll and billing cycle today — not a pilot.
- A monthly report for each insurer billing unit, generated in a single pass via macro
- A one-page summary built from a second, independently-calculated engine that cross-checks the monthly reports
- A Final Totals view with period-over-period change built in
- A 12-month rolling view and two dashboards, pairing slicers with PIVOTBY
A Note on Confidentiality
This engagement is covered by an NDA. The client has approved anonymized use of this work in presentations, and this page was shared with them prior to publication. Client, insurer, and provider identities have been anonymized. Dollar values shown are fictitious but structurally representative of the real output.